Export Google map as a KML file.
Convert KML to GPX here: https://kml2gpx.com
On the Garmin Edge SD card there’s a folder called “NewFiles”. Copy the GPX file here.
After power-cycling the Edge the map will be available.
Export Google map as a KML file.
Convert KML to GPX here: https://kml2gpx.com
On the Garmin Edge SD card there’s a folder called “NewFiles”. Copy the GPX file here.
After power-cycling the Edge the map will be available.
I had to do the following to connect to a D-Link DNS320L network drive after an update to Ubuntu Studio 20.10 (prior to the update the drive was discovered and mounted automatically in Dolphin).
client min protocol = NT1
//192.168.0.99/Volume_1 /mnt/raid-lounge cifs vers=1.0,guest,uid=1000,iocharset=utf8 0 0
CUDA allows the GPU on the graphics card to be used for general computing.
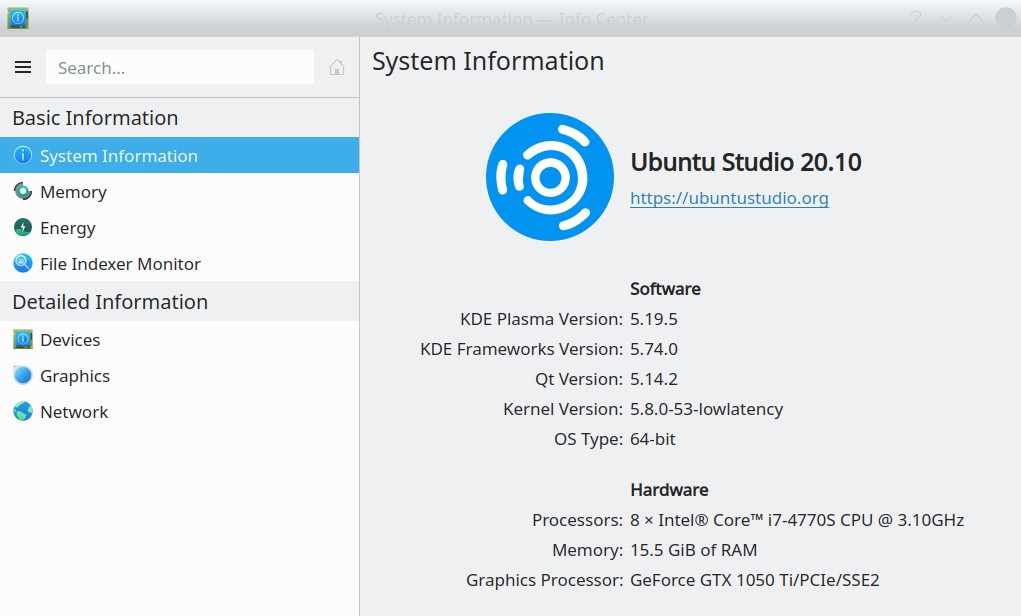
System info:
Installation instructions here: https://docs.nvidia.com/cuda/cuda-installation-guide-linux/index.html
But then I found these instructions and followed them: https://askubuntu.com/questions/1288672/how-do-you-install-cuda-11-on-ubuntu-20-10-and-verify-the-installation
I didn’t do the verification step at the end, but after a reboot following installation I can now select CUDA as the Cycles render device in Blender.
Use the Snap Creek Duplicator plugin. The plugin generates a zip file and an installer.php script. First, delete all the files and folders in the local WordPress root folder. Then copy the zip file and the installer script to this folder, and browse to installer.php. Click ‘next’ a few times, enter the database details, done.
Do
sudo chown -R www-data:myusername /path/to/your/wordpress/install/
then
sudo find /path/to/your/wordpress/install/ -type d -exec chmod 775 {} \;
sudo find /path/to/your/wordpress/install/ -type f -exec chmod 664 {} \;
Here’s how to get Ardour set up so that the DAW can control a MIDI synthesizer. I’m using Ubuntu Studio, Ubuntu 20.04.1 LTS, Ardour 5.12.0.
a2jmidid -j default
a2jmidid is a bridge between the ALSA MIDI system and JACK.
The frequency response tester is used to measure the response of a Dunlop Cry Baby wah-wah pedal, model GCB 95. The response was measured in three positions, heel-down, toe-down and approximately in the middle. The data from the three results files was combined and plotted in LibreOffice Calc.
A Raspberry Pi with an Adafruit MAX31855 thermocouple interface board and a solid-state relay is used to control the temperature profile in an oven for reflow surface-mount soldering. The software running on the Raspberry Pi is here: https://github.com/apollo-ng/picoReflow. The instructions in the README.md file in the picoReflow project are good, with one modification needed: to auto-start on power-up, the reflow script in lib/init needs “#! /bin/sh” on the first line of the file, not line 12 as given.
I set my Raspberry Pi with a static IP address of 192.168.0.222, so the address to browse to see the oven interface is 192.168.0.222:8081.
The oven used is an Argos Cookworks 20L 1380W model with top and bottom heaters. The heaters are connected in parallel. Extra insulation is added around the top and sides of the oven chassis and in the door. The seams are sealed with high-temperature putty. Some cross-bars in the rack are removed to reduce thermal mass.
An Analog Discovery 2 (AD2) signal generator is configured to generate a sine wave through a range of frequencies. The sine wave is fed into the Unit Under Test (UUT) and an AD2 oscilloscope channel is used to sample the UUT’s output. A Python script automates the whole thing and produces a .csv file and graphical plot of the results. Python script details are here.
The AD2 mounts conveniently on a standard die cast aluminium enclosure (e.g. Hammond 10758). The enclosure houses connectors to route the signals and a switch and LED to select jack or XLR inputs.
Scope channel 1 connects to either a 6.35mm jack or the positive pin of a balanced XLR, selected with the switch. Channel 2 connects to the negative pin of the XLR.
The signal generator is fed to the UUT and directly back into channel 2 of the oscilloscope so the phase delay between channel 1 and channel 2 can be calculated, for the phase response measurements.
The first thing to do is connect the signal generator output directly back into the ‘scope input, as shown in the photo above, in order to check the frequency response of the tester. The test script produces the following plot:
The plot is reassuringly flat from 10Hz to 200kHz, with a negligible but consistent gain offset of around 0.2dB throughout.